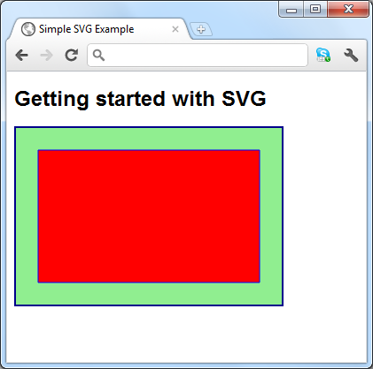
In this tutorial you will learn more HTML and look at workign with graphics using Svg. This will allow you to write a simple HTML site that you can then view in a web browser of your choice
About this Tutorial
Objectives
Delegates will learn to develop applications using HTML5/CSS3 and JS. After completing this course, delegates will be able to:
Use Visual Studio 2012 effectively
Create commercial HTML5 Web Applications
Develop Websites that may use web sockets, animations and geolocation
Audience
This course has been designed primarily for programmers new to the .Net development platform. Delegates experience solely in Windows application development or earlier versions of HTML/CSS and JavaScript will also find the content beneficial.
Prerequisites
No previous experience in web programming is required. But any experience you do have in programming will help. Also no experience in browser IDE’s is required. But again any experience you do have with programming development environments will be a valuable.
Experience using a contemporary OO language such as C++ or C# would be useful but is not required.
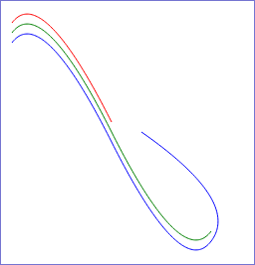
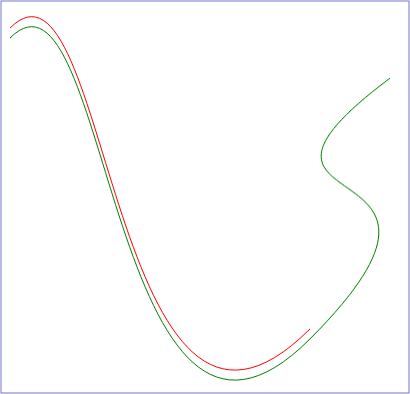
Also use “S” flags to create follow-on cubic curves
C cp1X cp1Y cp2X cp2Y endX endY
S cp2X cp2Y endX endY <path stroke="red" fill="none"
d="M 70 100
C 170 0, 170 600, 370 400" />
<path stroke="green" fill="none"
d="M 70 110
C 170 10, 170 610, 370 410
S 250 300, 450 150" />
Lab
In this lab, you’ll see how to create SVG vector graphics dynamically. You’ll create elements such as <rect>, <circle>, and <polygon> by using the HTML Document Object Model (DOM) API, and add them to an <svg> element on the web page.
You’ll also see how to define styles, handle events, and transform SVG content dynamically using a combination of traditional JavaScript code and Jquery.
The solution is available to download from the top of the tutorial, the initial version you will be working through and the final version that allows you to check your code.
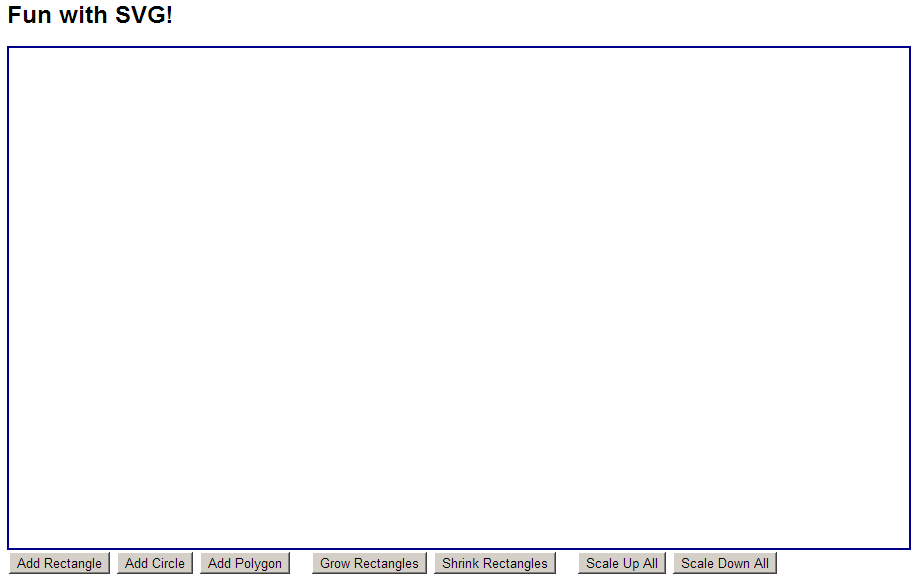
Familiarization – Open a browser and browse to FunWithSvg.html in the final folder. The Web page appears as follows:
The Web page has a large <svg> element (enclosed in a border), with various buttons beneath it that allow the user to create and manipulate content in the <svg> element:
When you click dd Rectangle, Add Circle, or Add Polygon, it creates a new <rect>, <circle>, or <polygon> element and adds it as a child of the <svg> element in the DOM tree. Each shape has a random location, size, colour, and opacity. Also, the <polygon> elements have a random number of points.
When you click Grow Rectangles or Shrink Rectangles, it doubles or halves the size of all the <rect> elements in the web page. This illustrates how you can locate specific SVG elements in the DOM tree.
When you click Scale All Up or Scale All Down, it transforms all child elements inside the <svg> element by applying a scaling factor of 2.0 or 0.5 respectively.
Also notice the following general features:
When you hover over a shape in the <svg> element, it sets the fill-opacity of the shape to 1.0. When you move the mouse away, the fill-opacity returns to its original value. This illustrates how to define CSS styles for SVG elements.
When you mouse-click any shape in the <svg> element, it adds a thick red border around the shape. If you click the shape again, it removes the border. This illustrates how you can handle events on SVG elements.
If you hold the SHIFT and CTRL buttons down while you mouse-click a shape in the <svg> element, it removes the element from the DOM tree. This illustrates that you have complete control over the DOM tree in SVG.
Now switch to the initial folder and open FunWithSvg.html in the text editor. We’ve already written the HTML mark-up and some of the JavaScript code. There are several TODO comments indicating where you will add your code in each exercise. Note the following points:
At the bottom of the page, we’ve already defined an <svg> element, plus all the buttons. Each button is associated with a click-handlerfunction all of these functions exist, but their implementations are mostly empty at the moment.
At the top the top of the page, we’ve defined a CSS style for <svg> elements.
We’ve already imported the Jquery script file. You’ll use various JqueryAPIs in this lab, to simplify manipulation of the DOM tree.
svgNS – Contains the XMLnamespace for SVG elements. When you create SVG elements (e.g. <rect>), the elements must have this XML namespace.
svgPanelWidth and svgPanelHeight – These variables are assigned in the init() function, to hold the width and height of the <svg>element. These variables are used when it comes to generating random locations and sizes for SVG elements.
Our <script> tag also contains various stubbed-out functions, plus two helper functions near the bottom that are already complete:
getRandomAttributes() – Returns an object containing random values for a shape’s location, size, colour, and opacity.
getRandomInt() – Returns a random integer in a specified range.
Adding <rect> elements by using DOM – Now that you understand how the Web page is structured, it’s time for you to start implement the empty functions.
You’ll start with the addRect() function, to create a new <rect> element and add it as a child of the <svg> element in the DOM tree Follow these steps (each of these steps corresponds to a TODO step in the code):
Create a new <rect> element (with the correct SVG namespace), by using the standard DOM function document.createElementNS(). Pass in two parameters:
The namespace URI for the element use the svgNS variable here.
The tag name for the element, i.e. “rect”. var rect = document.createElementNS(svgNS, "rect");
Set the x, y, width, height, fill, and fill-opacity attributes on the <rect> element. We’ve already called getRandomAttributes() to get random property values, so use the standard DOM function setAttribute() to set each attribute on the <rect> element. For each call to setAttribute(), pass in two parameters:
The name of the attribute you want to set, e.g. “x”.
The value you want to set it to, e.g. attrs.x. var attrs = getRandomAttributes();
rect.setAttribute("x", attrs.x);
rect.setAttribute("y", attrs.y);
rect.setAttribute("width", attrs.w);
rect.setAttribute("height", attrs.h);
rect.setAttribute("fill", "rgb(" + attrs.r + "," + attrs.g + "," + attrs.b + ")");
rect.setAttribute("fill-opacity", attrs.o);
Append the <rect> element as a child of the <svg> element, so that it becomes linked-in to the DOM tree. You can use the append() Jquery function to achieve this effect, e.g. $(“svg”).append(rect). $("svg").append(rect);
That completes the implementation of the addRect() function, so save your work and open your Web page in the browser. Click Add Rectangle several times you should see a new rectangle appear each time, with a random location, size, colour, and opacity.
Adding <circle> elements by using DOM
The next step is to implement the addCircle() function, to create a new <circle> element and add it as a child of the <svg> element in the DOM tree.
This is similar to the code you wrote in addRect(), but note the following points:
The <circle> element requires attributes named cx and cy that define the centre-point of the circle. Set these attributes using the values in the attrs.x and attrs.y randomised properties circle.setAttribute("cx", attrs.x);
circle.setAttribute("cy", attrs.y);
The <circle>element also requires an attribute named r that defines the radius of the circle. Set this attribute to half of the value in the attrs.w randomised property. circle.setAttribute("r", attrs.w / 2);
Also remember to set the fill and fill-opacity properties for the <circle> element. circle.setAttribute("fill", "rgb(" + attrs.r + "," + attrs.g + "," + attrs.b + ")");
circle.setAttribute("fill-opacity", attrs.o);
Test your new functionality. You should be able to generate circles at random locations, radii, colours, and opacity.
Lab 2: Setting styles
Lab 2: Setting styles
Basic Stroke and Fill Styles
To set a fill style or a stroke style, set these attributes: stroke="color" fill="color"
stroke-width="width" fill-rule="nonzero" | "evenodd"
stroke-opacity="opacity-fraction" fill-opacity="opacity-fraction"
stroke-dasharray="dash-gap series" etc...
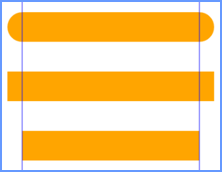
Setting Line Styles
To define line endings: stroke-linecap="round" | "square" | "butt"
To define what happens at path joints: stroke-linejoin="bevel" | "round" | "miter"
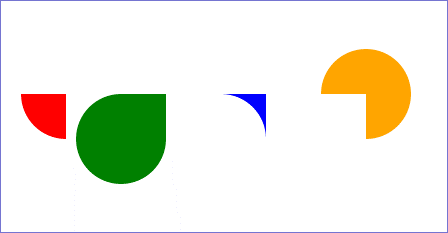
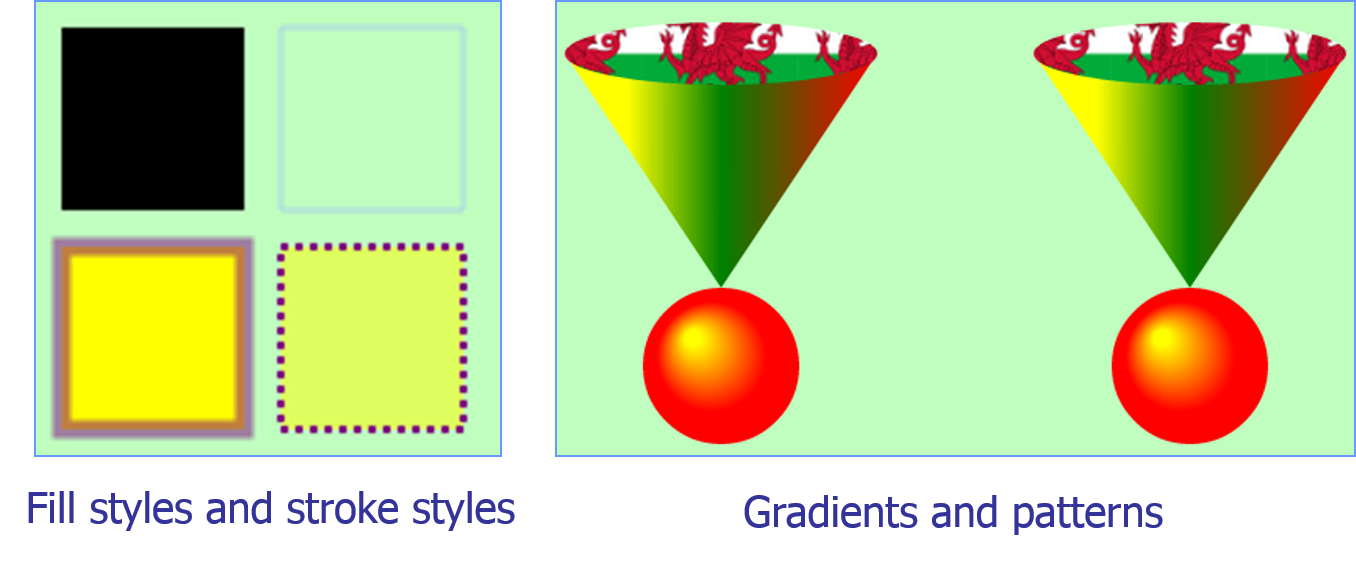
Gradients and Patterns
To fill a shape with a gradient or a pattern – Starting with normal gradients using colours <linearGradient id="gradient1a" x1="0%" y1="0%" x2="100%" y2="0%"
gradientUnits="objectBoundingBox">
<stop offset="0.2" stop-color="yellow" />
<stop offset="0.5" stop-color="green" />
<stop offset="1.0" stop-color="red" />
</linearGradient>
<radialGradient id="gradient2" fx="0.3" fy="0.3"
gradientUnits="objectBoundingBox">
<stop offset="0.1" stop-color="yellow" />
<stop offset="0.7" stop-color="red" />
</radialGradient>
Next an image pattern and their shapes that can use the gradients <pattern id="wales" patternUnits="userSpaceOnUse" width="100" height="100">
<image xlink:href="wales.png" x="0" y="0" width="100" height="100" />
</pattern>
</defs>
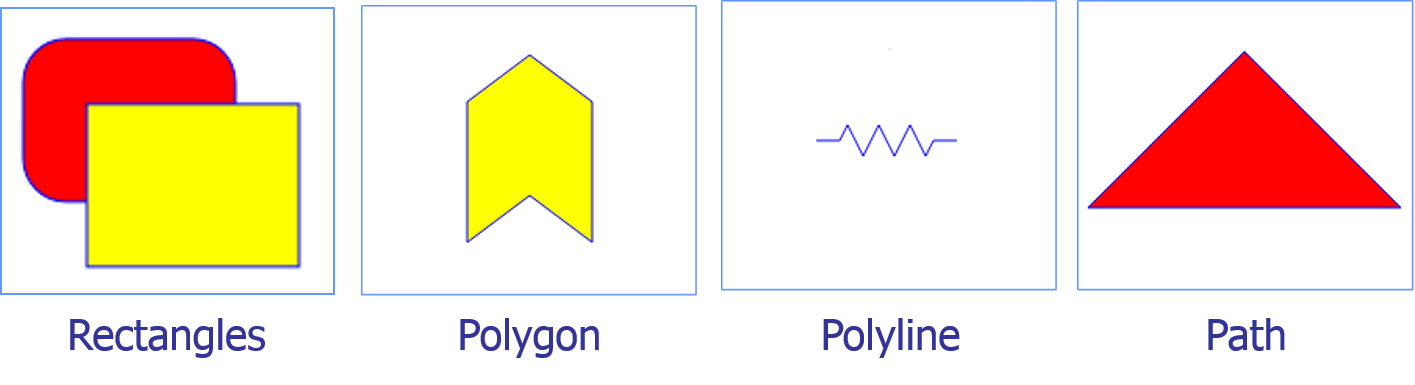
<polygon points="50,50 250,50 150,200" fill="url(#gradient1a)" />
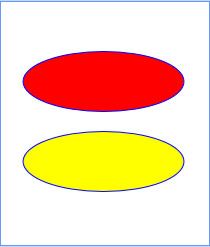
<ellipse cx="150" cy="50" rx="100" ry="20" fill="url(#wales)" />
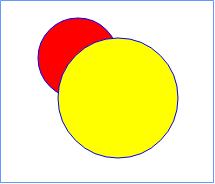
<circle cx="150" cy="250" r="50" fill="url(#gradient2)" />
As mentioned in the chapter, one of the key differences between SVG graphics and Canvas graphics is that with SVG, the shapes are actually resident in the DOM tree. This means you can interact programmatically with SVG elements, in exactly the same way as you would with normal HTMLelements.
To illustrate these capabilities, this exercise asks you to define CSS style rules for SVG elements, and to handle events on SVG elements
Let’s deal with CSS styles first. At the top of the Web page in the text editor, locate the TODO 3a comment. Define a CSS style rule such that whenever you hover over any element inside an <svg> element, it sets its fill-opacity property to 1.0. svg *:hover {
fill-opacity: 1.0;
}
Now let’s deal with event handling. In the init()function, locate the TODO 3b comment. At this location, handle the mouseup event for any elements inside an <svg> element use the live() Jqueryfunction as follows (remember, this ensures the event handler works for all SVG elements that will ever be created, not just the ones that happen to exist at this moment in time): $("svg *").live("mouseup", function(e) {
...
});
Implement the body of the event handler function as follows:
If the SHIFT and CTRL keys are depressed, delete the current element from the DOM tree. Here are some hints:
To test if the SHIFT and CTRL keys are depressed, use the e.shiftKey and e.ctrlKey properties on the event argument. if (e.shiftKey && e.ctrlKey)
To delete the current element, use the $(this).remove() jQuery function. (this).remove();
Otherwise, toggle the stroke and stroke-width attributes (i.e. turn the shape’s border on or off). Hints:
First, determine if the stroke attribute is currently set on the element, by using the $(this).attr(“stroke”)Jquery function. var stroke = $(this).attr("stroke");
If the stroke attribute is set, remove this attribute by using the $(this).removeAttr(“stroke”) jQuery function. Do likewise to remove the stroke-width attribute.
If the stroke attribute isn’t set, set this attribute now by using the $(this).attr(“stroke”, “red”) jQuery function (for example). Do likewise to set the stroke-width attribute (e.g. set it to 5).
After you’ve done all this, test your new functionality fully in the browser.
Lab 3: Additional techniques
Lab 3: Additional techniques
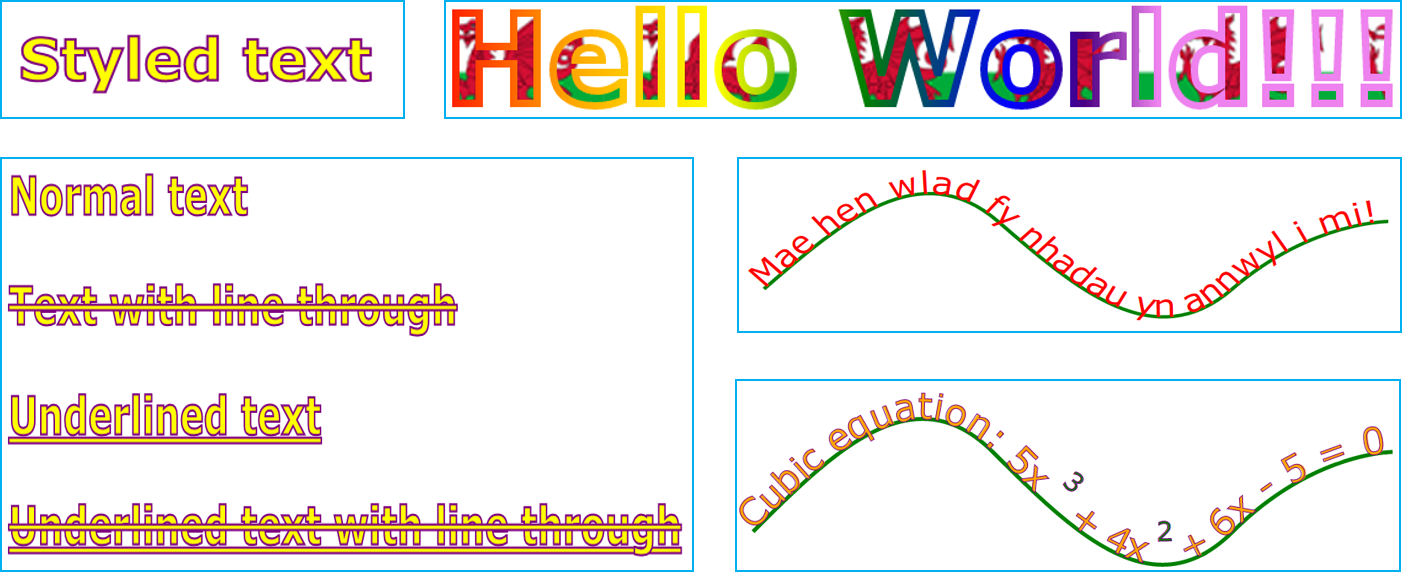
Drawing Text
To draw text: <text x="20" y="100">
Simple text
</text>
Useful text attributes:
fill, stroke, stroke-width
font-size, font-family, font-weight
text-decoration
Additional text techniques:
Use <linearGradient>, <radialGradient>, and <pattern>
Use <textPath> to draw the text on a path
Use <tspan> to define separately-styled sections in a text path
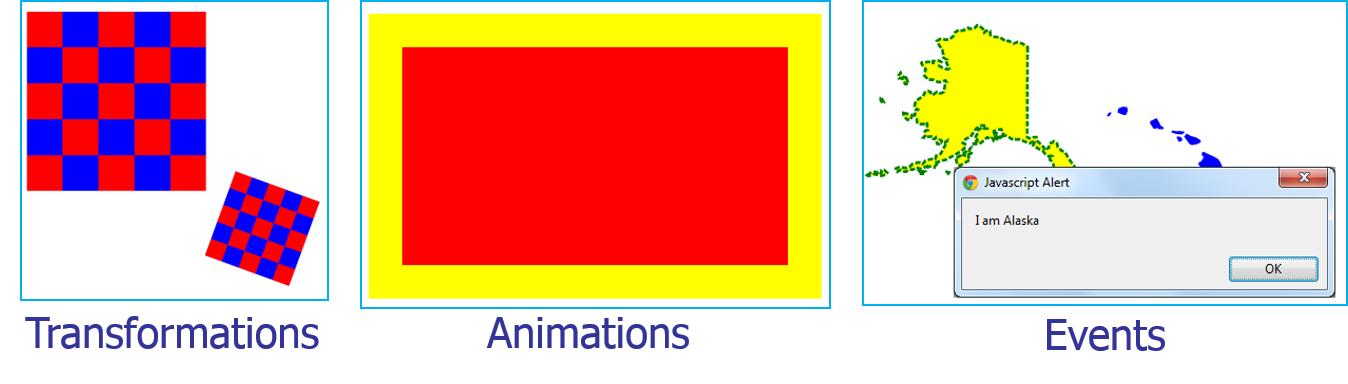
As we described in the chapter,SVG supports transformations such as scaling, translation, rotation, and skewing. We showed how to define static transformations using fixed mark-up such as the following: <g transform="translate(320, 0), scale(2), skewX(-30)">
<rect ... ... ... />
</g>
In the static mark-up above, we’ve defined a <g> element to wrap the content that we want to transform. The <g> element has a transform attribute that specifies the transformation(s) that we want to apply to that content.
It’s also possible to apply transformations dynamically, by creating the <g> element programmatically and adding it to the DOM tree where needed. The final application illustrated this behaviour via the Scale All Up and Scale All Down buttons, which scaled all shapes by a factor of 2.0 (to double their scale) and 0.5 (to halve their scale) respectively.
Try to implement this behaviour for yourself in the initial application, in the scaleAllUp() and scaleAllDown() stub functions. Here are some hints:
First, you need to locate all the elements inside the <svg> element – $("svg *:not(g)").each(function () {
For each child element, you need to wrap it in a separate <g> element… var g = document.createElementNS(svgNS, "g")
When you create <g> elements, remember to specify the SVG XML namespace. Also, set the transform attribute to an appropriate transformation string. g.setAttribute("transform", "scale(0.5)");
Use the $(this).wrap() jQuery function to wrap each element in a <g> element. $(this).wrap(g);
Well done. You have completed the tutorial in the HTML5/CSS3/JS course. The next tutorial is
If you liked this post, please comment with your suggestions to help others.
If you would like to see more content like this in the future, please fill-in our quick survey.
Manage cookie consent
You can view this website without consenting to extra cookies. However you will need to accept the 'marketing' cookies to send messages via the contact forms & see any maps displayed on the site
Functional
Always active
Cookies necessary for the website to work.
Preferences
The technical storage or access is necessary for the legitimate purpose of storing preferences that are not requested by the subscriber or user.
Statistics
The technical storage or access that is used exclusively for statistical purposes.Cookies used to track user interaction on the site, which helps us to evaluate & improve the website.
Marketing: Forms & additional content (Marketing)
We need your permission to place ‘marketing’ cookies, so you are able to use the contact forms & see embedded content e.g. videos and maps. - - - - We have added protection to our contact forms to help prove that a human (rather than a spambot) is filling


If you would like to see more content like this in the future, please fill-in our quick survey.